Cartogram
Problems:
Tags: statistics
A cartogram is a map in which some thematic mapping variable – such as travel time, population, or Gross National Product – is substituted for land area or distance. The geometry or space of the map is distorted in order to convey the information of this alternate variable. There are two main types of cartograms: area and distance cartograms. Cartograms have a fairly long history, with examples from the mid-1800s.
Source: [Wikipedia - Cartogram](http://en.wikipedia.org/wiki/Cartogram)
Examples
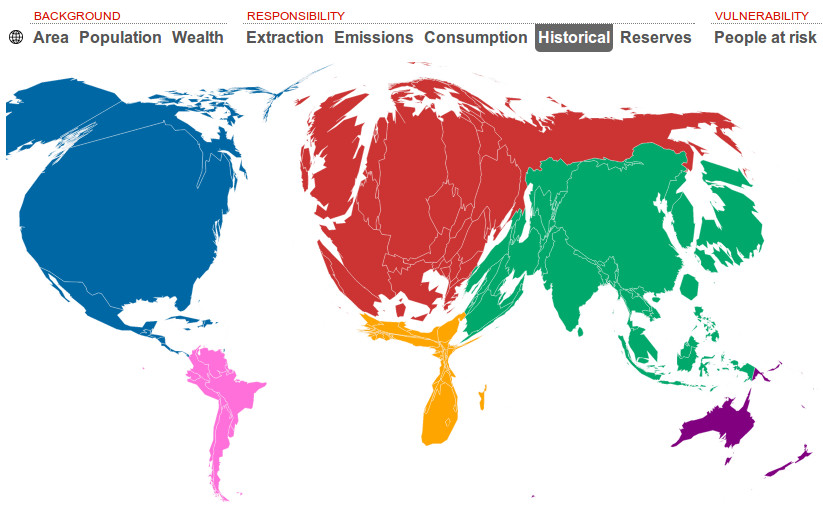
CO2 emissions from energy use 1850–2007 by Kiln
France urbanization level

Other examples: