Choropleth map
Problems:
Tags: statistics
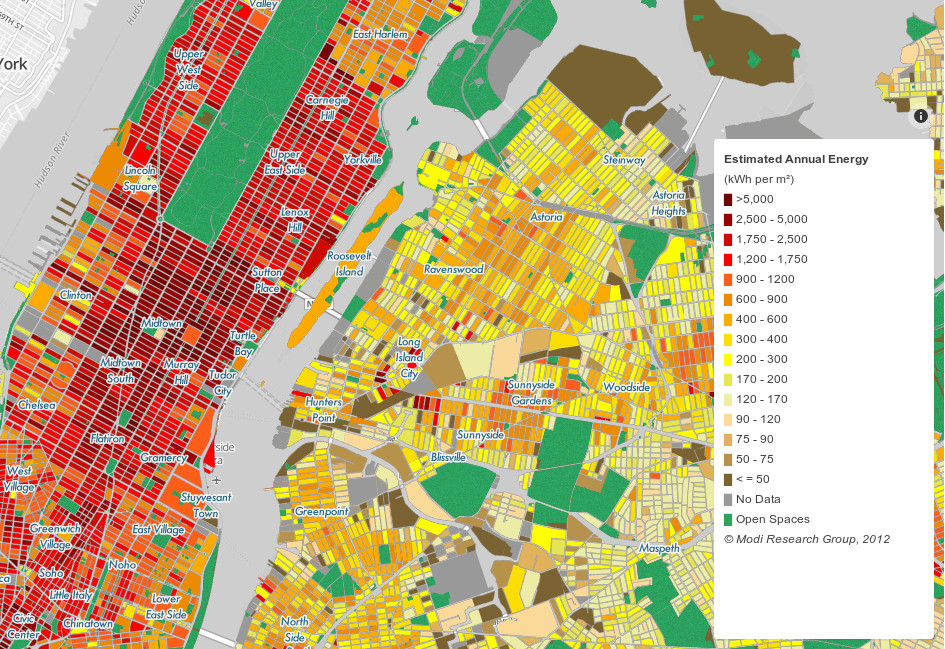
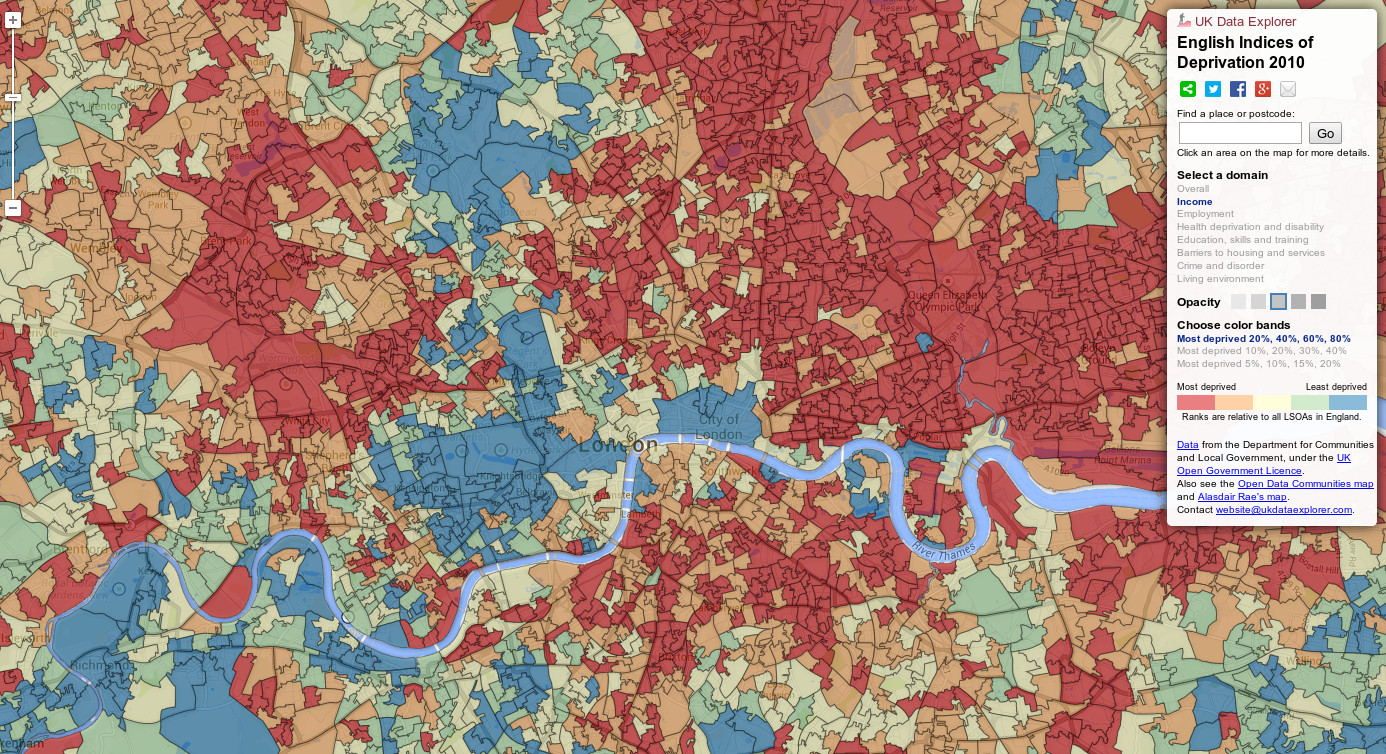
A choropleth map (Greek χώρο– + πλήθ[ος]), ("area/region" + "multitude") is a thematic map in which areas are shaded or patterned in proportion to the measurement of the statistical variable being displayed on the map, such as population density or per-capita income.
The earliest known choropleth map was created in 1826 by Baron Pierre Charles Dupin. The term "choroplethe map" was introduced 1938 by the geographer John Kirtland Wright in "Problems in Population Mapping".
Source: [Wikipedia - Choropleth map](http://en.wikipedia.org/wiki/Choropleth_map)