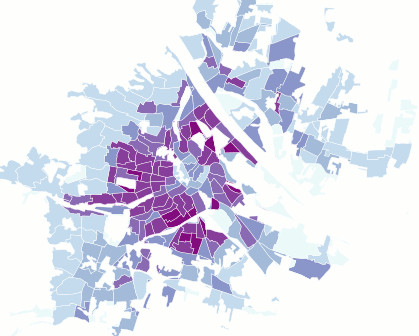
Dasymetric map
A technique in which attribute data that is organized by a large or arbitrary area unit is more accurately distributed within that unit by the overlay of geographic boundaries that exclude, restrict, or confine the attribute in question. For example, a population attribute organized by census tract might be more accurately distributed by the overlay of water bodies, vacant land, and other land-use boundaries within which it is reasonable to infer that people do not live.
Source: [ESRI GIS dictionary](http://support.esri.com/en/knowledgebase/GISDictionary/term/dasymetric%20mapping)
The dasymetric map is a method of thematic mapping, which uses areal symbols to spatially classify volumetric data. [...] Cartographers use dasymetric mapping for population density over other methods because of its ability to realistically place data over geography. Considered a hybrid or compromise between isopleth and choropleth maps, a dasymetric map utilizes standardized data, but places areal symbols by taking into consideration actual changing densities within the boundaries of the map. To do this, ancillary information is acquired, which means the cartographer steps statistical data according to extra information collected within the boundary. If appropriately approached it is far superior to choropleth maps in relaying statistical data within areas of interest.
Source: [Wikipedia - Dasymetric map](http://en.wikipedia.org/wiki/Dasymetric_map)
See also: