Dot distribution map
Problems: spatialize highlight
Tags: superposition
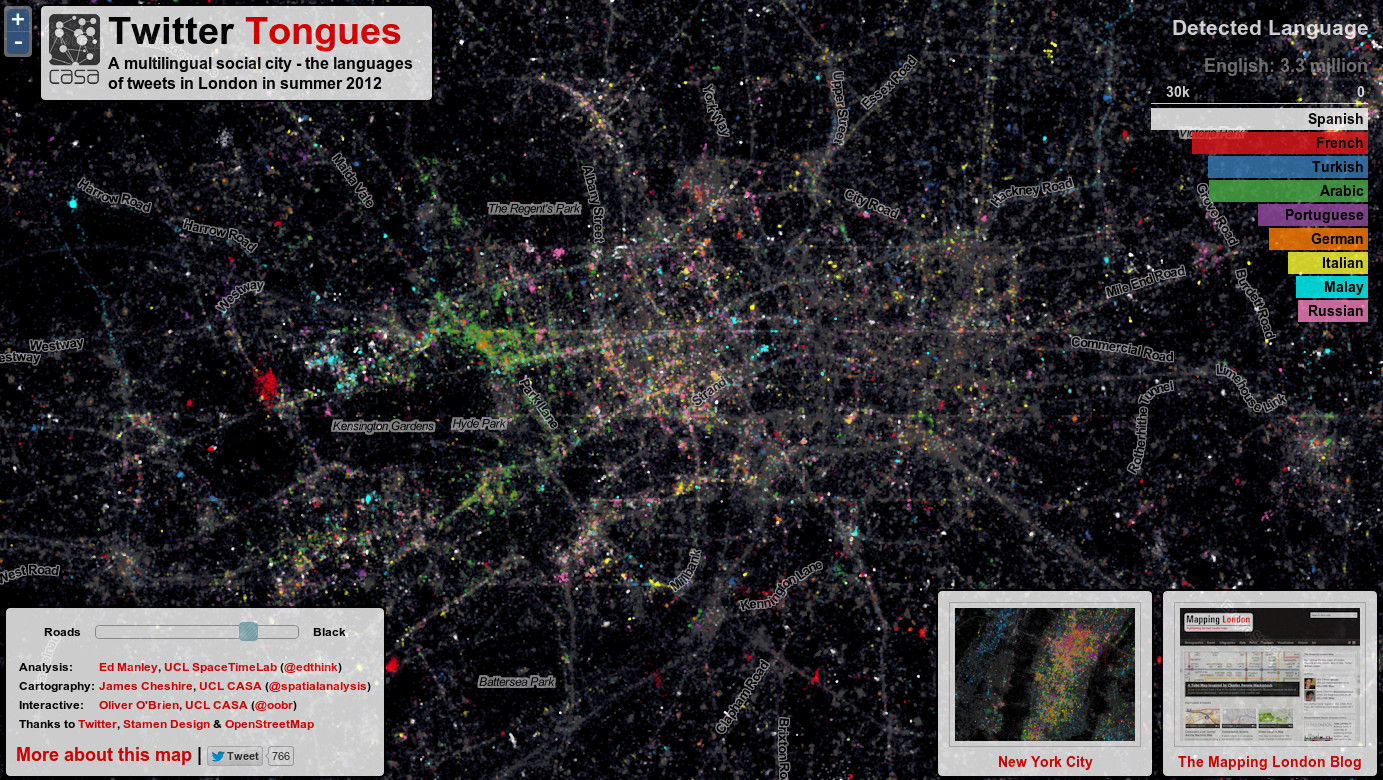
A dot distribution map (also known as dot density map) is as a map type that uses a dot symbol to show the presence of a feature or phenomenon. Dot maps rely on a visual scatter to show spatial pattern. Types of dot maps:
- One-to-one: In a one-to-one dot map, each dot represents one single recording of a phenomenon. Because the location of the dot corresponds to only one piece of data, care must be taken to ensure that the dot is represented in its correct spatial location. Inaccuracies in the location of the dot can misrepresent the data being mapped. Various methods exist for determining the exact spatial location of a single point, including geocoding.
- One-to-many: In a one-to-many, or dot-density map, each dot on the map represents more than one of the phenomena being mapped. The number of data represented by each dot is determined by the map author and may be the product of data availability. Some data, such as the addresses of cancer patients, may not be available for mapping due to restrictions on access to individuals' medical records. In one-to-many dot distribution maps, the reader must be careful not to interpret the dots as actual locations, as the dots represent aggregate data and are often arbitrarily placed on a map. Methods of dot placement include by areal unit centroid, random dispersement, and uniform (evenly spaced) placement, among others.
Source: [Wikipedia - Dot distribution map](http://en.wikipedia.org/wiki/Dot_distribution_map)
See also:
- http://support.esri.com/en/knowledgebase/GISDictionary/term/dot%20distribution%20map
- http://support.esri.com/en/knowledgebase/GISDictionary/term/dot%20density%20map
- http://en.wikipedia.org/wiki/File:Carte_Philosophique_figurant_la_Population_de_la_France.jpg
- Pros and cons of dot maps: http://cartography.uni-muenster.de/en/map-types
