Heatmap
Problems:
Tags: statistics
Heat mapping, from a geographic perspective, is a method of showing the geographic clustering of a phenomenon. Also known as hot spot mapping, heat maps show locations of higher densities of geographic entities.
Source: [Caitlin Dempsey](http://christopherwesson.azurewebsites.net/2013/03/17/heat-maps-expand-into-the-mainstream/)
See also:
Examples
Mobility heatmaps in NY before / after Sandy ouragan in 2013
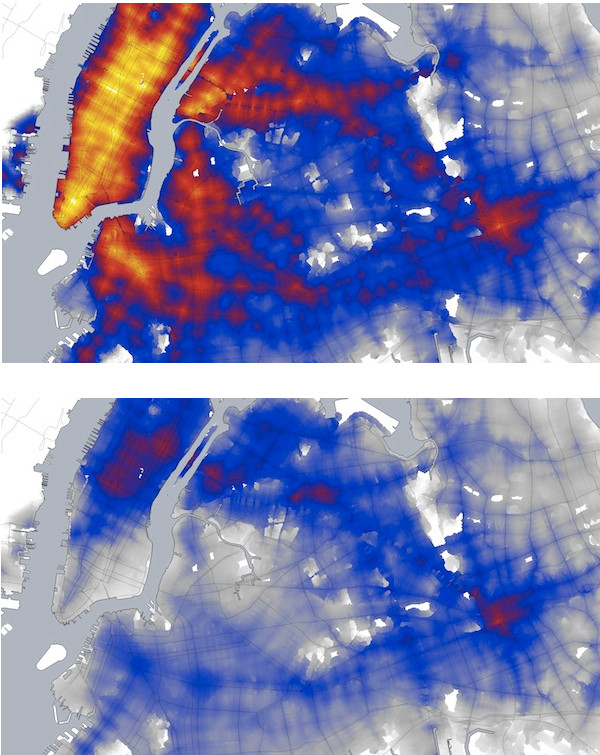
Yellow areas stand for the ones that can be reached by 7.5 millions of inhabitants, red ones by 6, blue ones by 4, gray ones by 2.
